Documentation
Libraries
Related
Documentation
Libraries
Related
This is an archive for Gestureworks 1.
To learn about the new Gestureworks, see the Gestureworks 2 Wiki
The Visualizer is a powerful visualization tool for multitouch input and gesture analysis. This standalone utility has been developed using Gestureworks Core and openFrameworks to display rich, real-time data from a variety of input devices. Gestureworks Core actively displays raw input data from multitouch devices as well as calculated cluster data and qualified gesture event output. It does this using a simple, easy-to-use GUI called the Visualizer.
Download the Gestureworks Core Visualizer
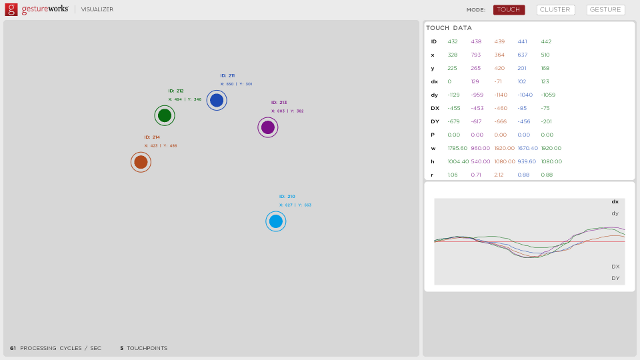
The touch panel shows the raw touch data associated with each touch point.
Tracked touch points are dispayed by a colored circle with a single ring. Next to this circle is associated raw touch data:
ID: The unique session point identification number,
x: The global position of the touch point on the x axis (relative the app window),
y: The global position of the touch point on the y axis (relative the app window).
The Touch Data block tabulates the data associated with each uniquely tracked touch point. Each touch point has a series of fundamental and calculated properties:
ID: Point identification number (unique to point and session),
X and Y: Current of the touch point (global, relative to app window),
dx and dy: Change in the position of the touch point between data samples,
DX and DY: Change in the position of the touch point between frames,
P: Touch pressure associated with the touch point,
w and h: Width and height of the touch point,
r: Radius of the touch point.
Below this block is a chart which dynamically shows changes in individual point positions (deltas). Displaying deltas in this way clearly shows trends and patterns in touch point motion and can be used to identify discontinuity in touch point tracking or tracking noise.
The cluster panel display calculated cluster information generated from touch point motion. The cluster data is a combination of results from kinemetric and geometric analysis that has been performed on the local cluster.
When this panel is selected and touch points are detected an additional display is over-layed onto the raw touch point data. This depicts the size and shape of the cluster as well as the center of the cluster. The calculated orientation of the hand is shown as a single thick line drawn from the center of the cluster towards the perimeter of the circle and the explicit identifications of the thumb which is represented by a thickened ring around the touch point.
The change in the rotation of the cluster is depicted by a wedge (or segment) drawn from the center of the cluster. Similarly the change in position is represented by a line drawn from center of the cluster which shows the magnitude and direction of the change. Additionally the change in separation (between touch points) in the cluster is shown by a ring drawn around the center of the cluster.
The Cluster Data block shows the fundamental data associated with a touch point cluster:
ID : Cluster identification number,
X and Y: Position of the center of the point cluster,
dx and dy: Change in the position of the cluster between frames,
dsx and dsy: Change in the separation of the touch points between frames,
dtheta; Change in the relative orientation of the touch points between frames,
w and h: Width and height of the cluster,
r: Radius of the cluster (max of width and height).
The chart below the data block shows the changing values (deltas) on a normalized scale. As the touch points move and the cluster properties are recalculated each frame and update the chart. Viewing deltas using the chart can clearly show trends, patterns and turning points in the data and give a clear sense of any noise associated with touch point tracking or delta calculation errors.
The gesture panel has three sub panels or views: 2D, Timeline and Stroke. These views show detailed gesture data structures after they have been processed by the gesture pipeline and collected as gesture events.
The 2D view in the gesture panel shows the gesture event based manipulation of a 2D square. The manipulations consist of affine translation, rotation and scaling which directly result from the DRAG, ROTATE and SCALE gesture events generated from cluster motion. The center of transformation is established from the center of the touch point cluster.
In the feedback block this view also shows a series of charts which display the dynamic output of each selected gesture event. The Gesture ML block displays the GML code segment that describes each selected gesture (associated with the rectangle).
The timeline view in the gesture panel shows raw touch events along with TAP and DOUBLE TAP gesture events. The each raw touch event is placed into a timeline frame when detected. However gesture events are batched so that multi-point TAP events events are grouped and counted as a single event then placed in a single frame which displays the number of touch points involved with the gesture. The timeline frame rate is synchronized to the application touch frame processing rate, which in the visualizer is set to 60fps. (Note: If no touch points are present the timeline will pause).
The Stroke view in the gesture panel displays vector paths directly drawn by touch point motion and matched STROKE gesture events. When a touch point is detected any change in the potion of the touch point will draw a line which represents the path of the touch point. These paths are then checked against paths defined in the GML. When a match is made a STROKE gesture highlights the corresponding graphic in the feedback block. There are four main types of STROKE gesture available in the default GML associated with eh visualizer: Letters, Numbers, Shapes, Symbols and Greek which can be selected in the Gesture feedback block.